Maps from the #30DayMapChallenge: each one tells a short story with real data (the maps themselves are in Spanish).
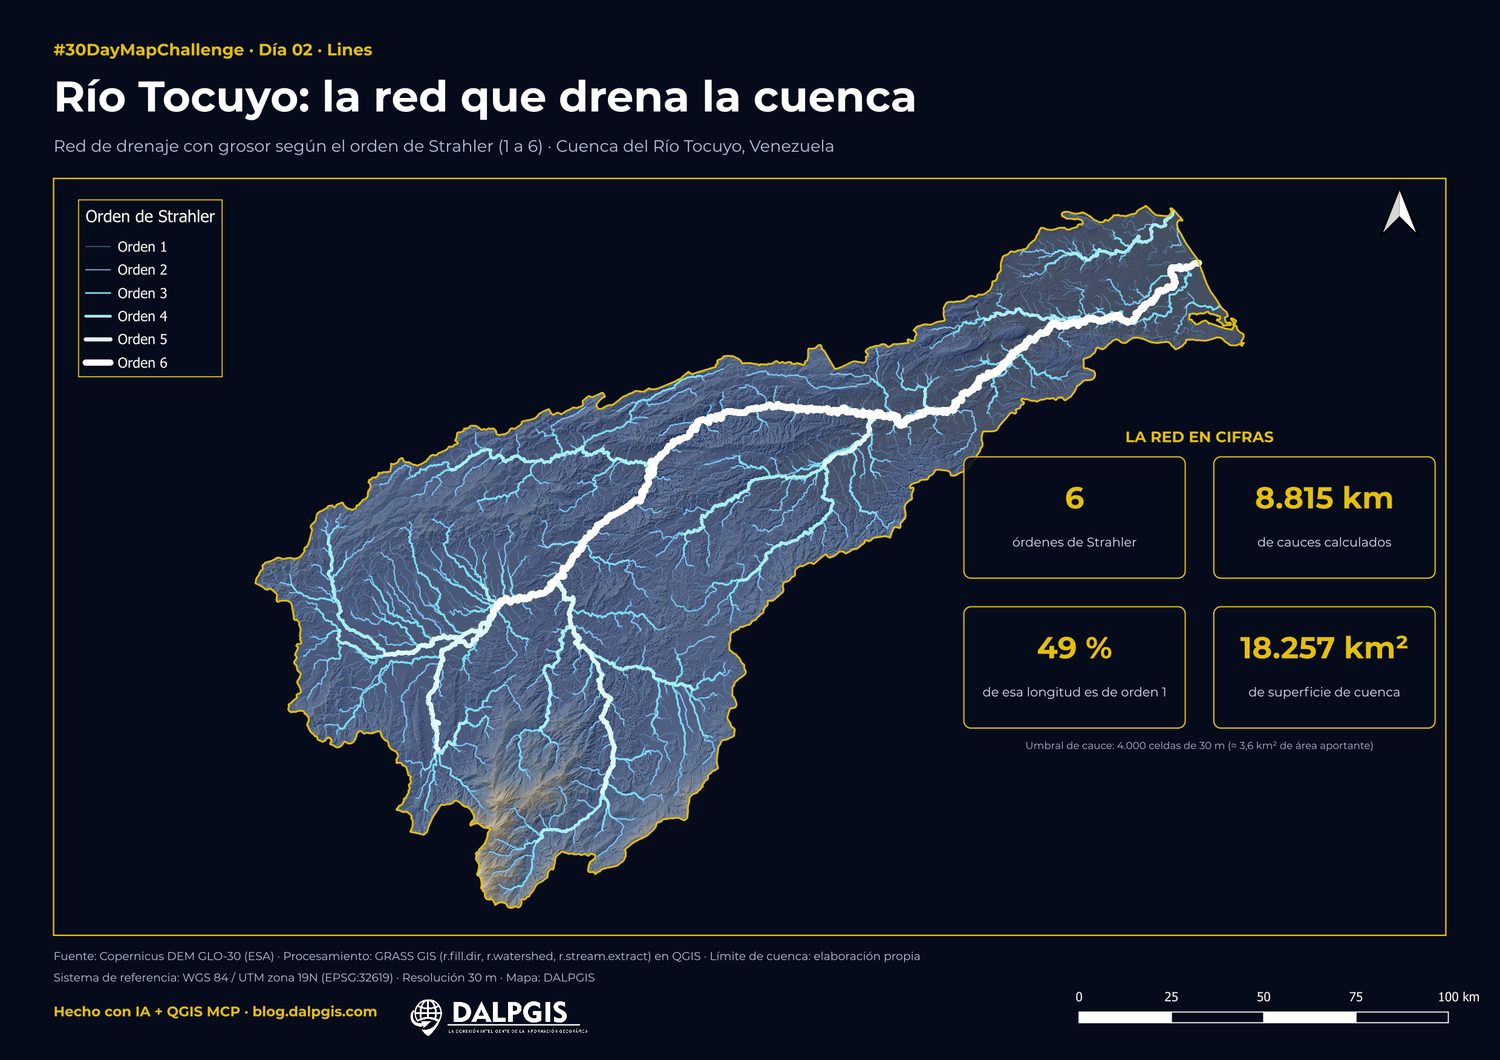
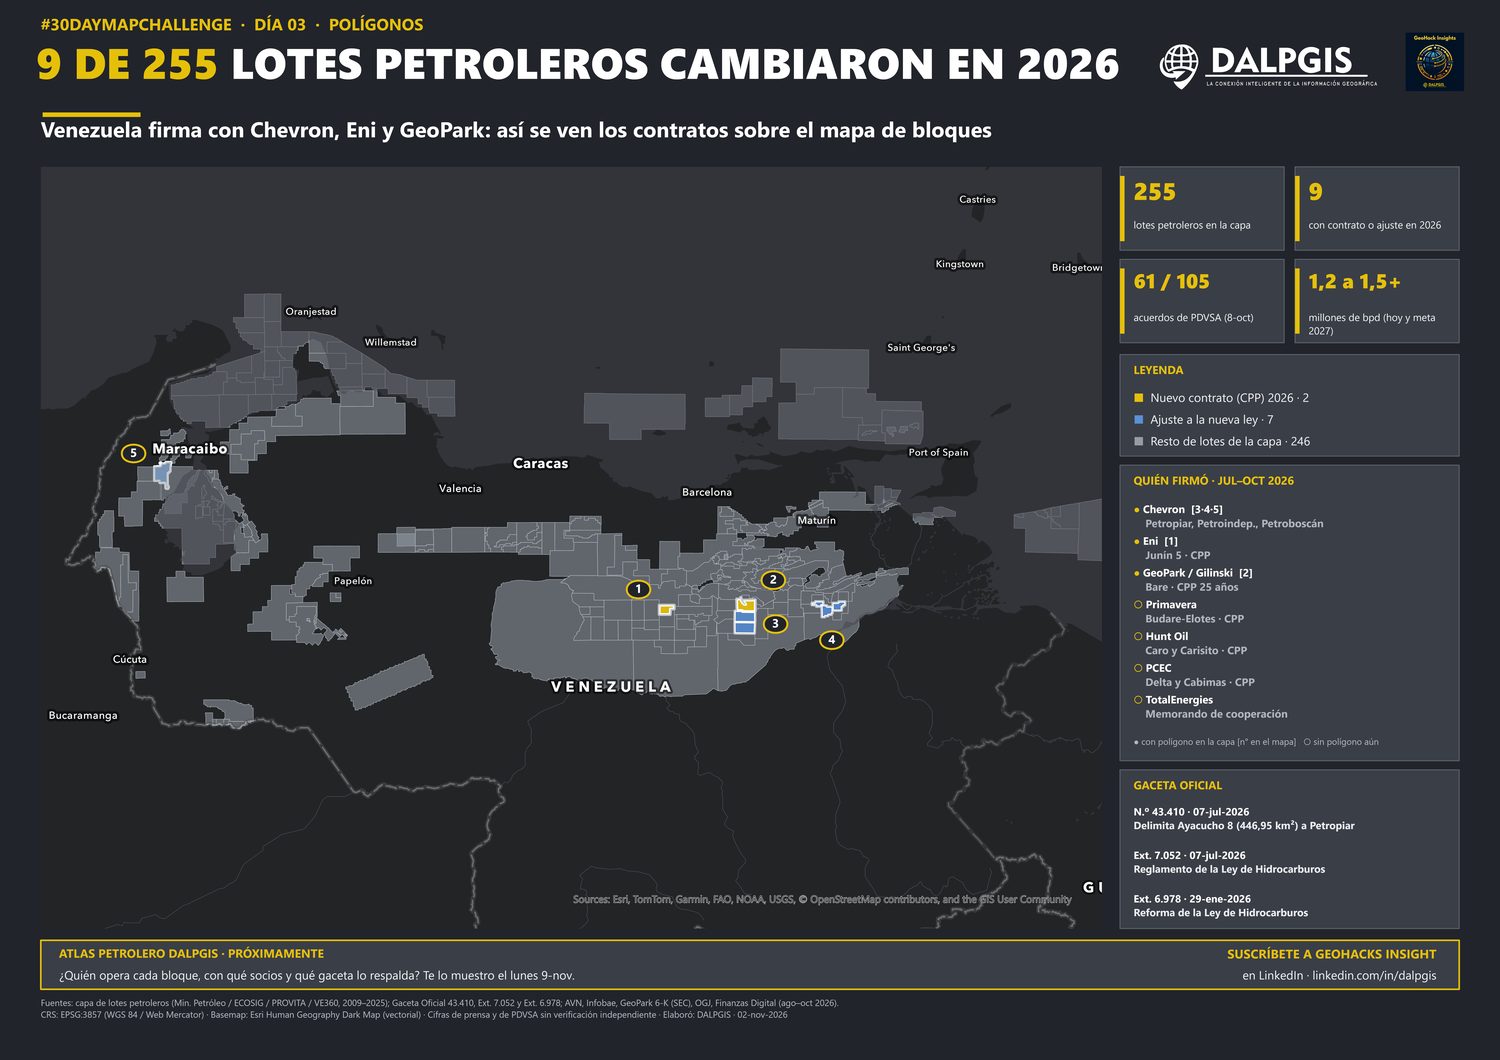
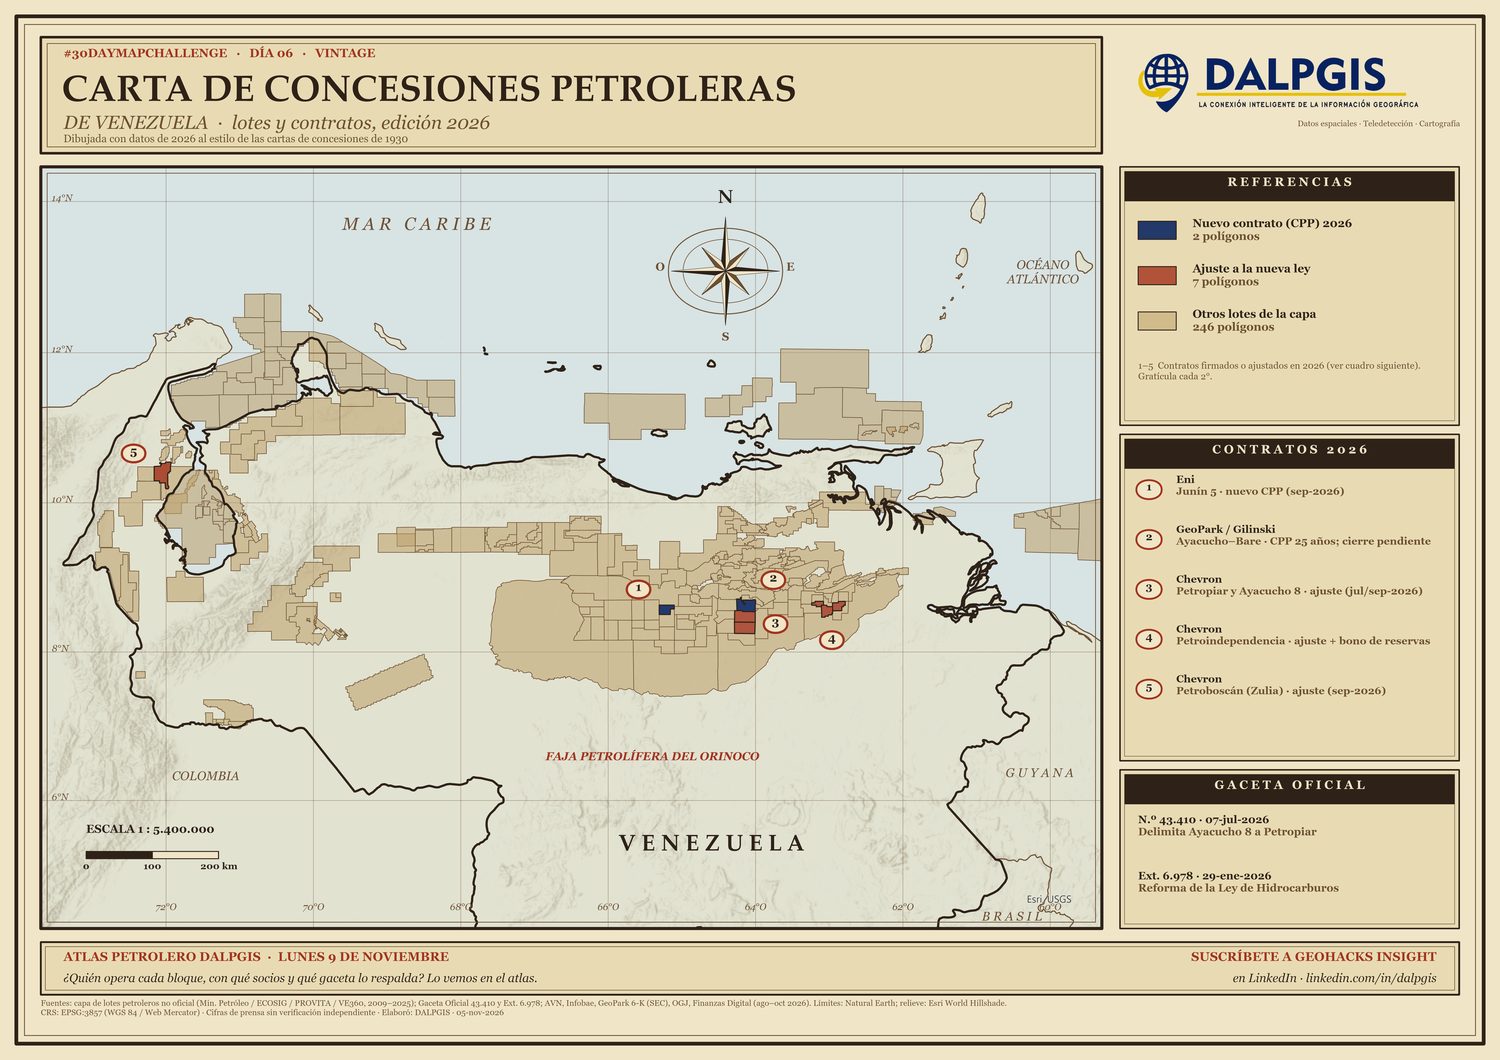
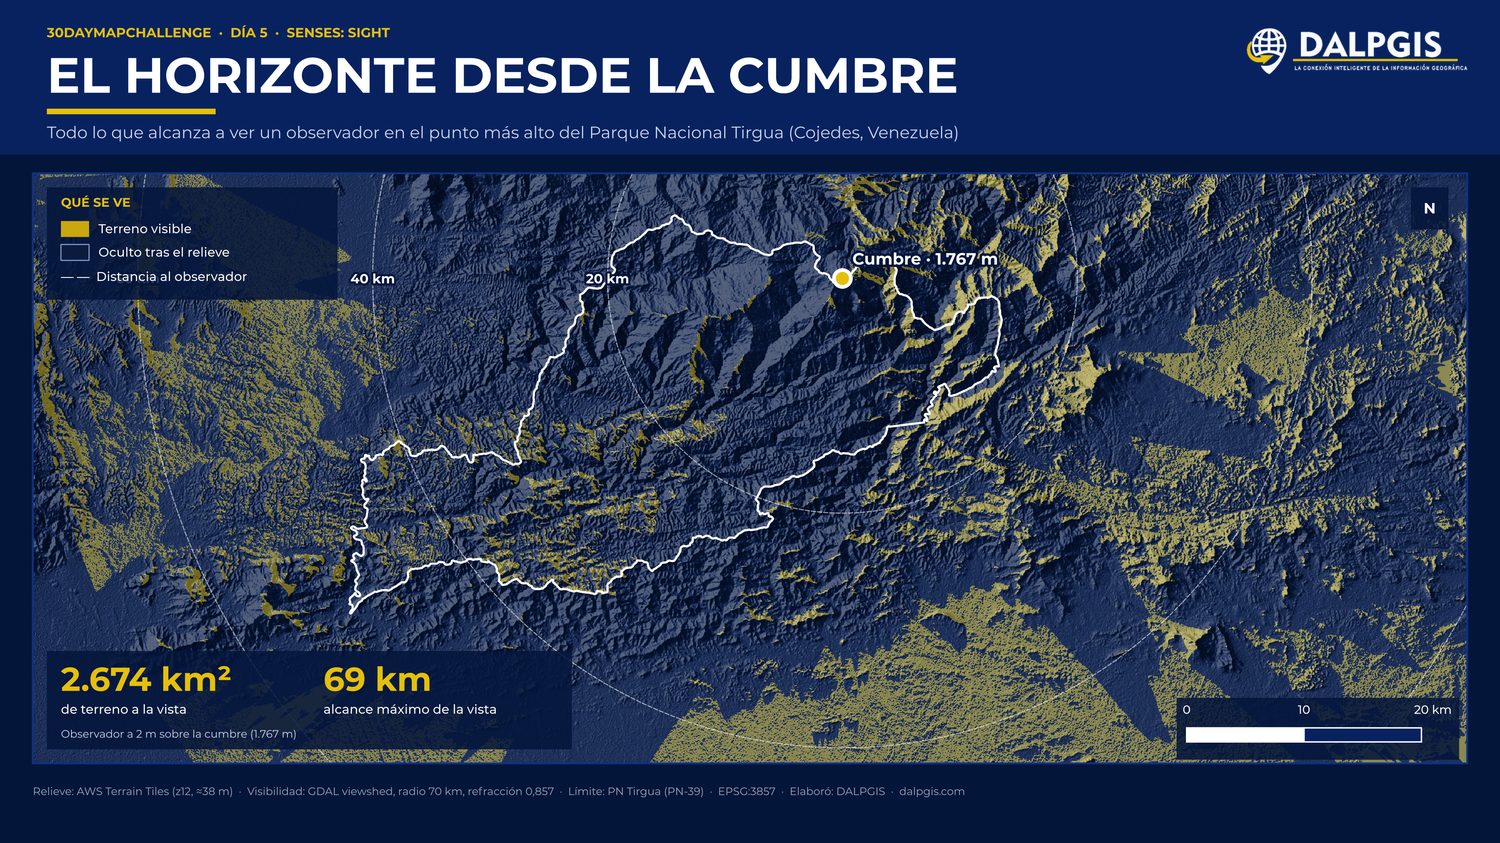
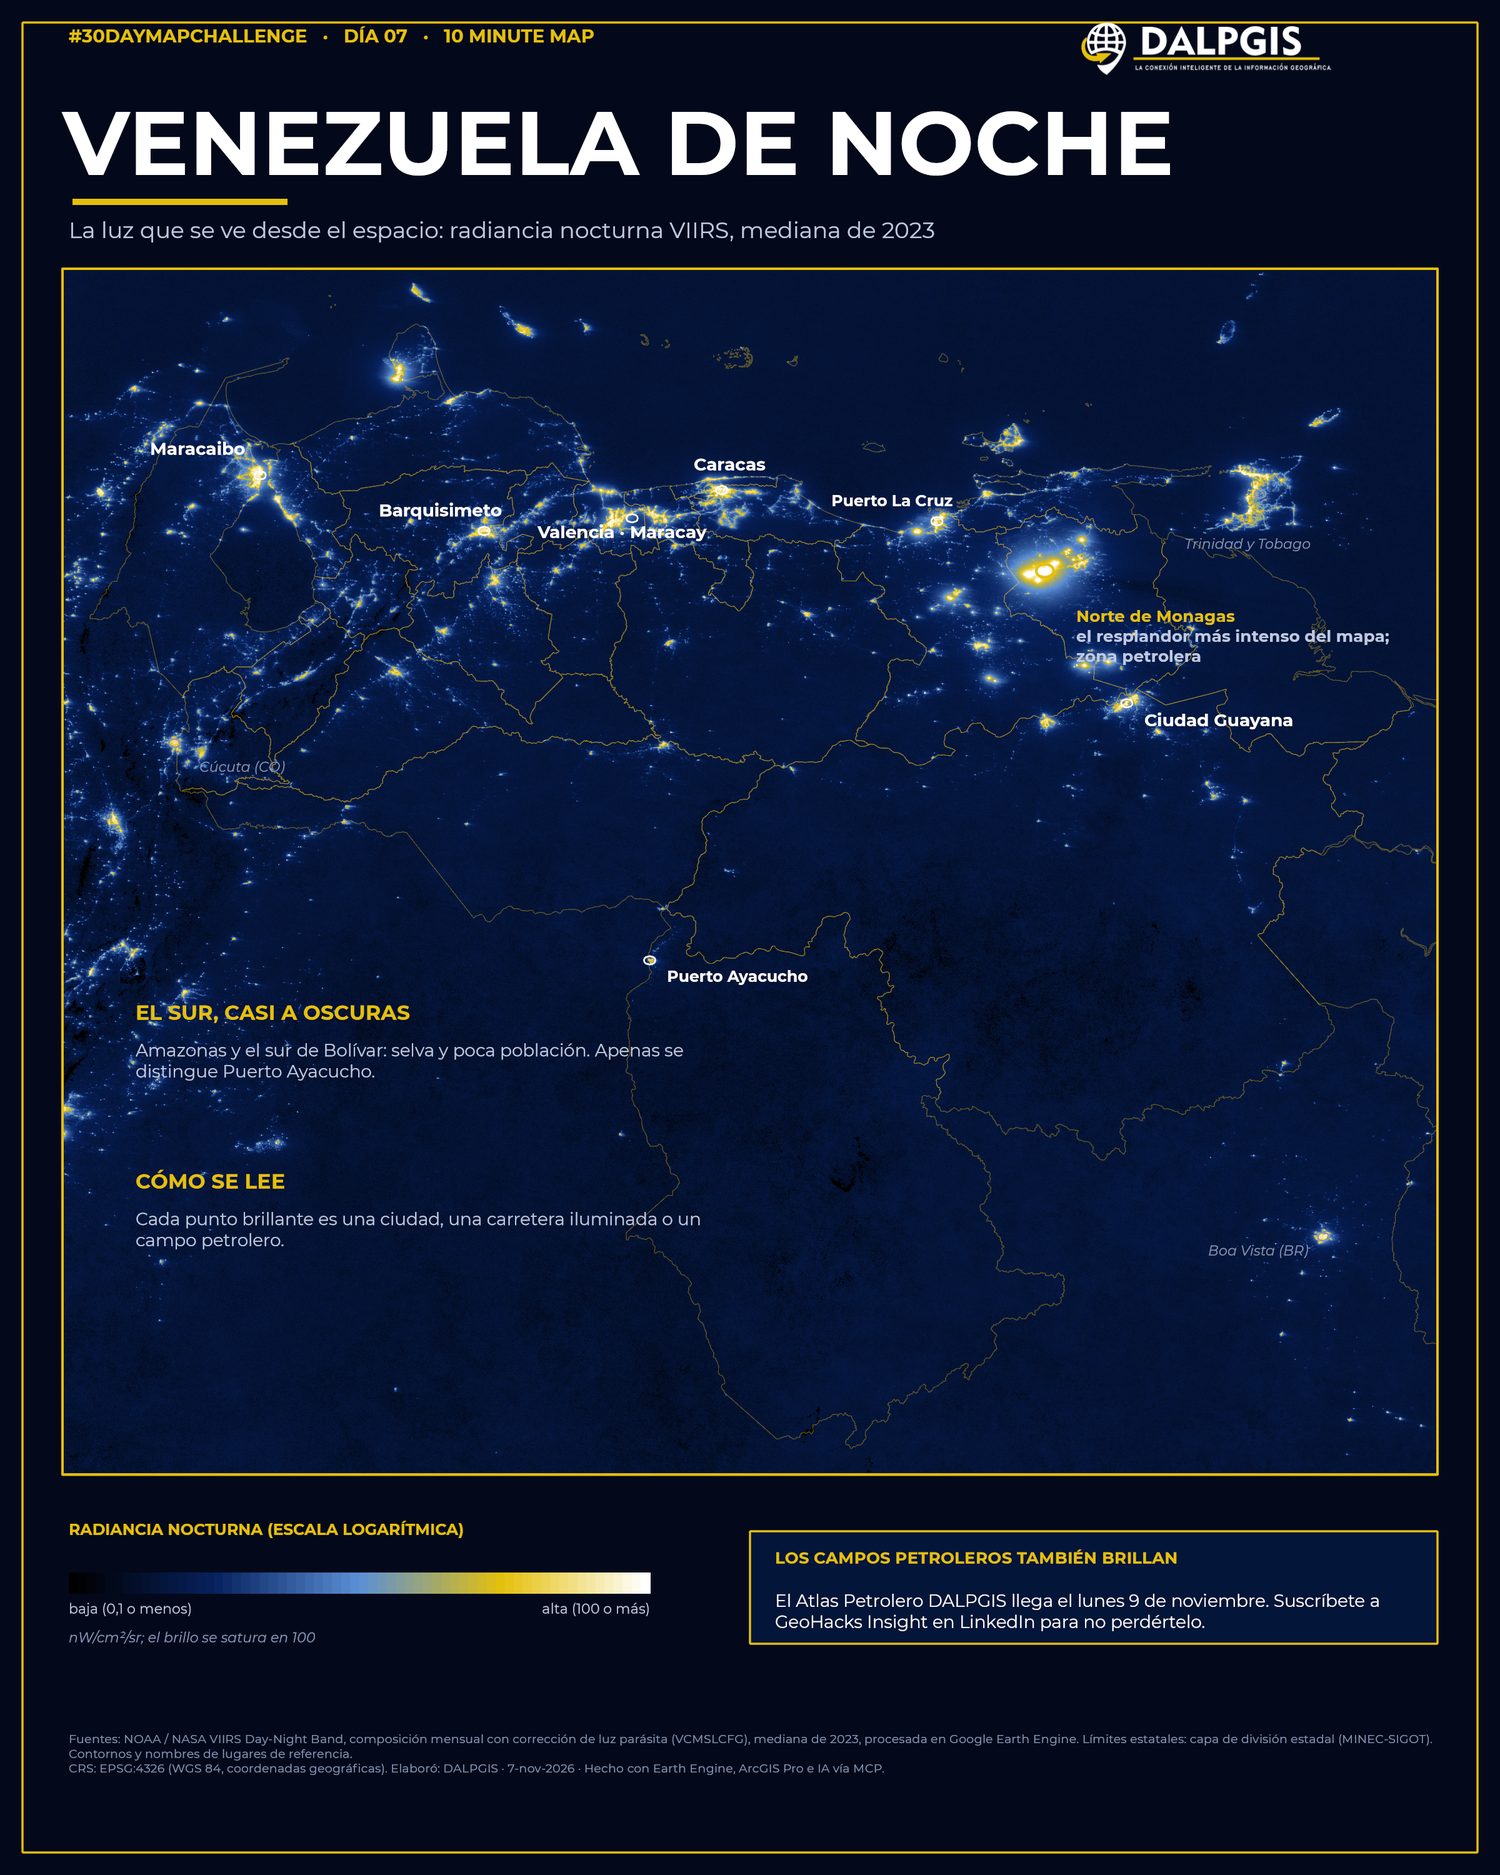
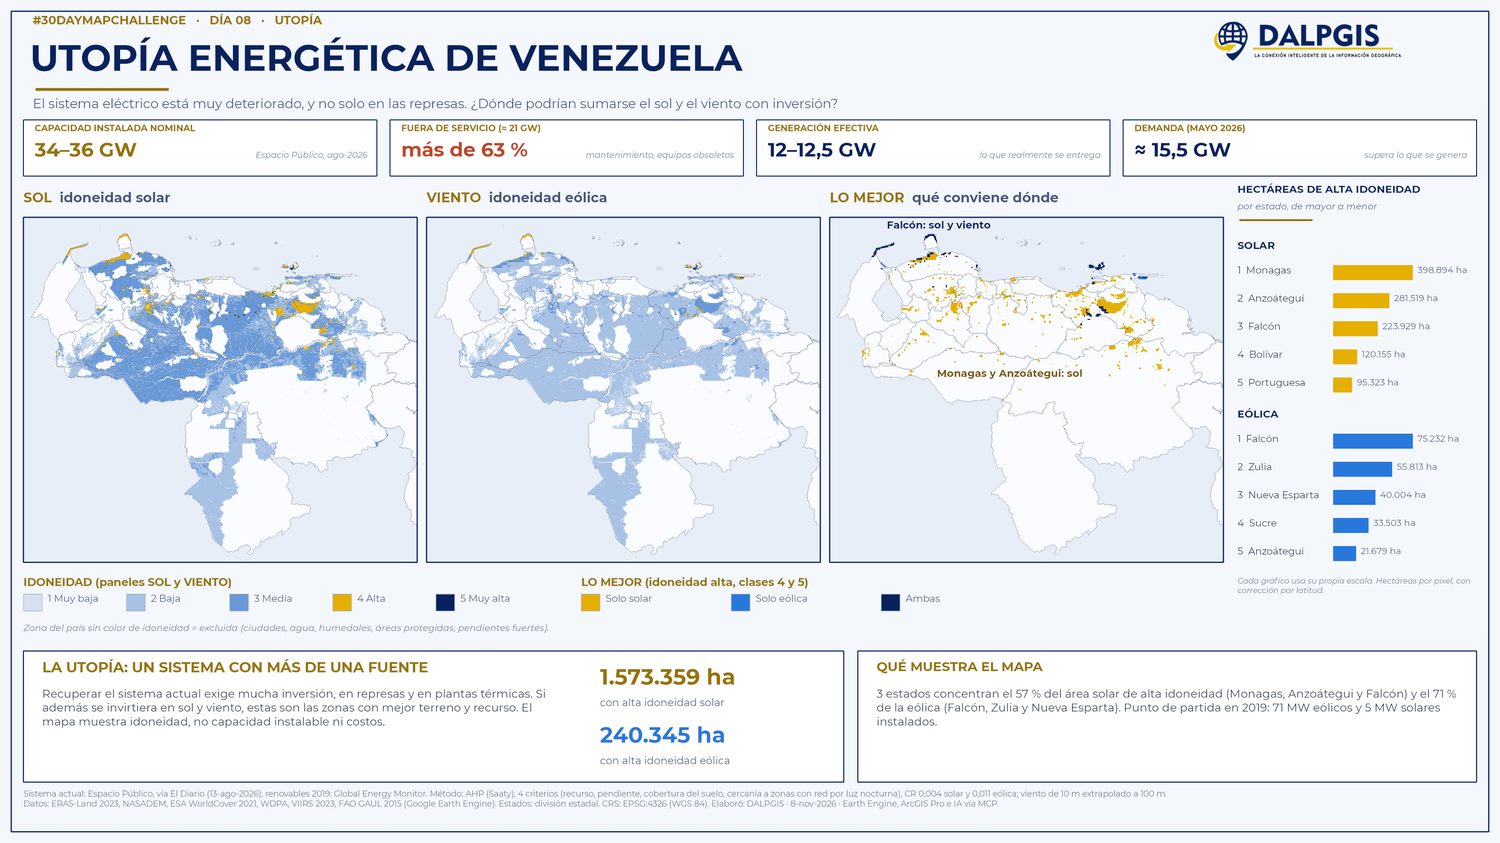
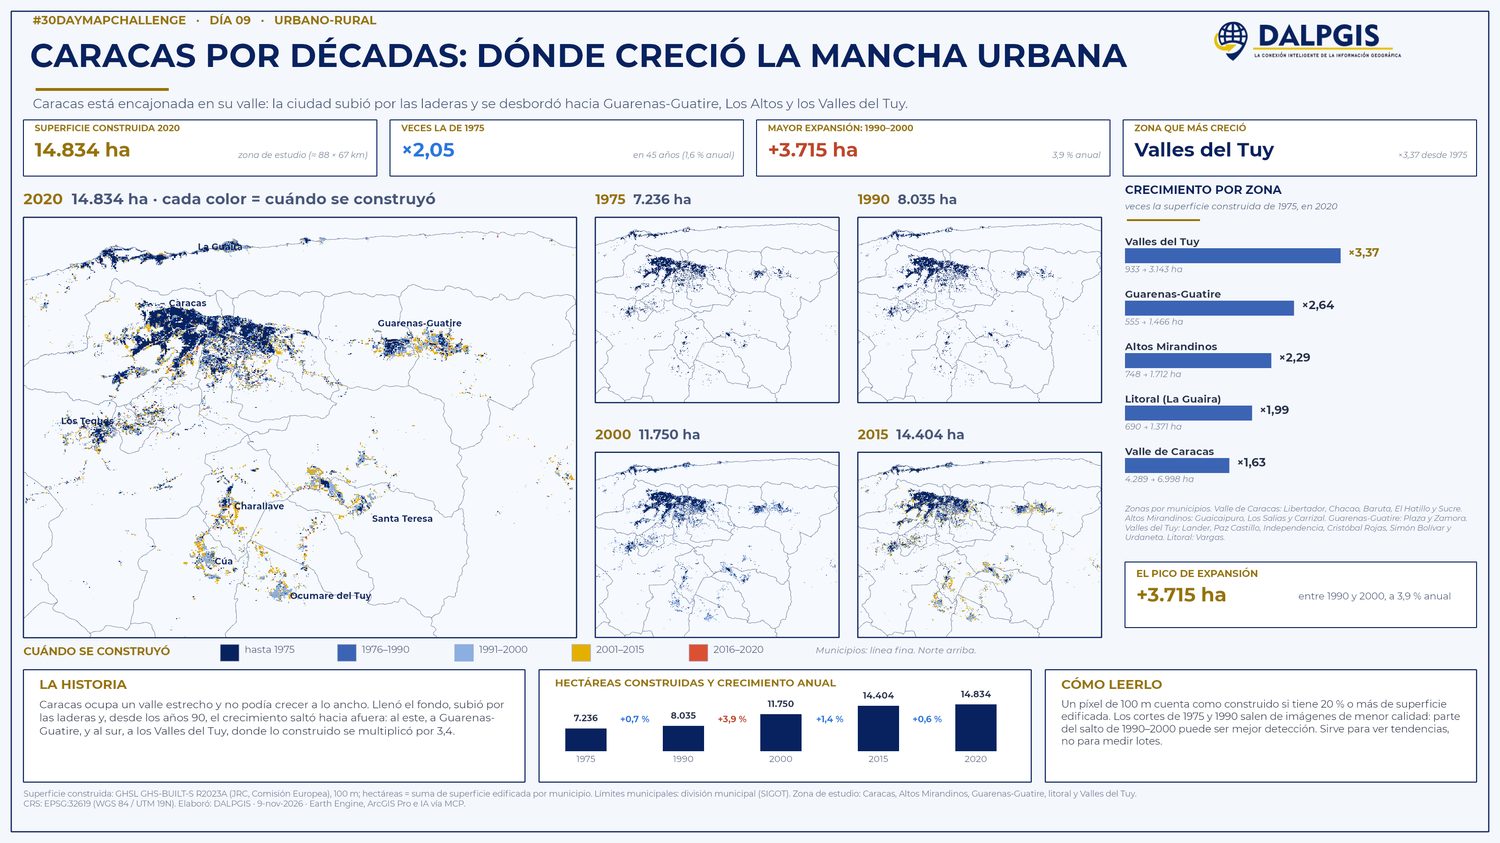
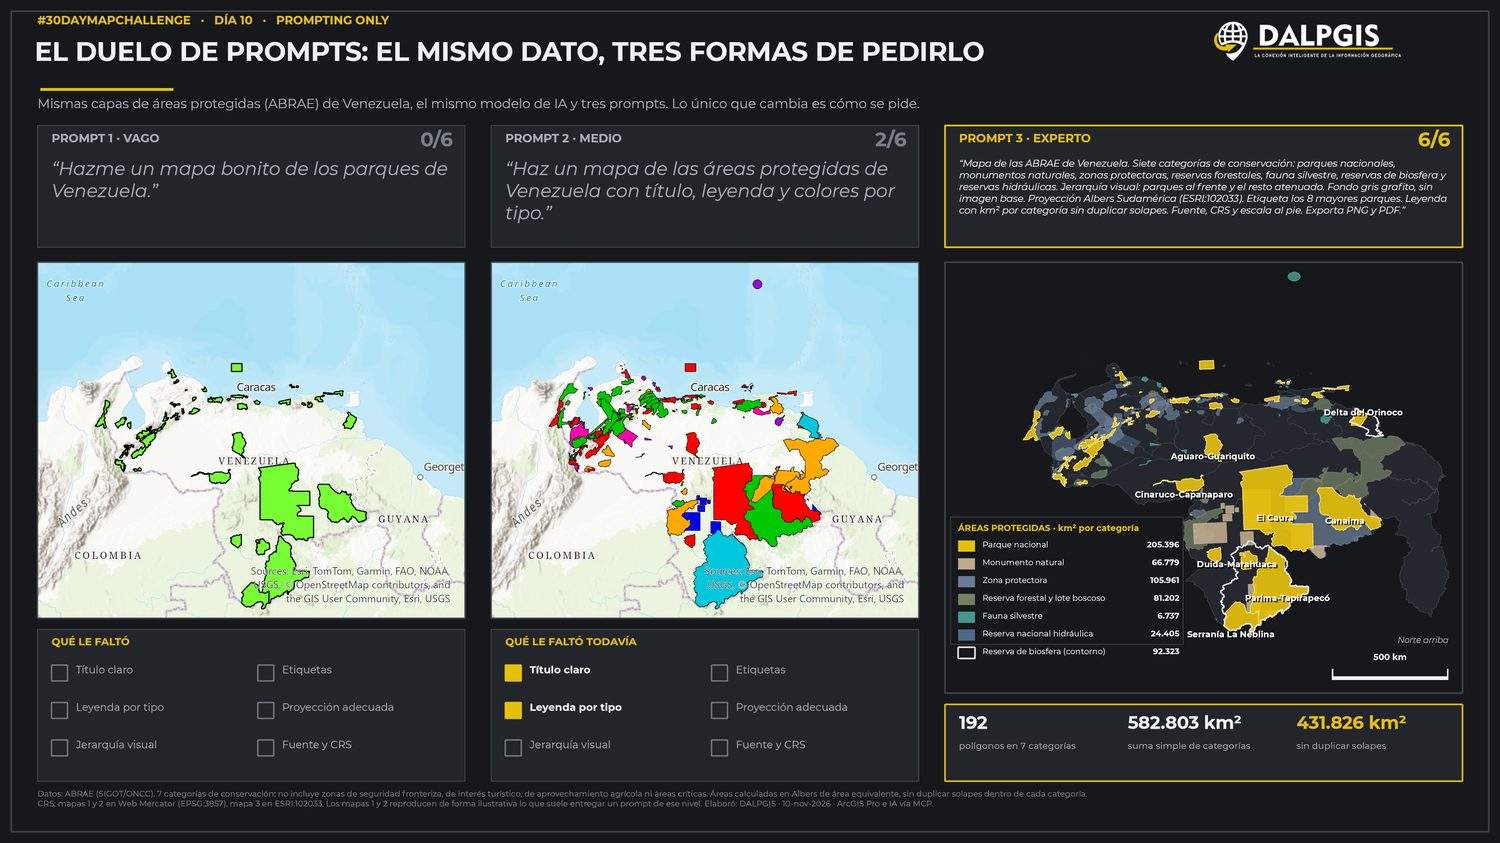
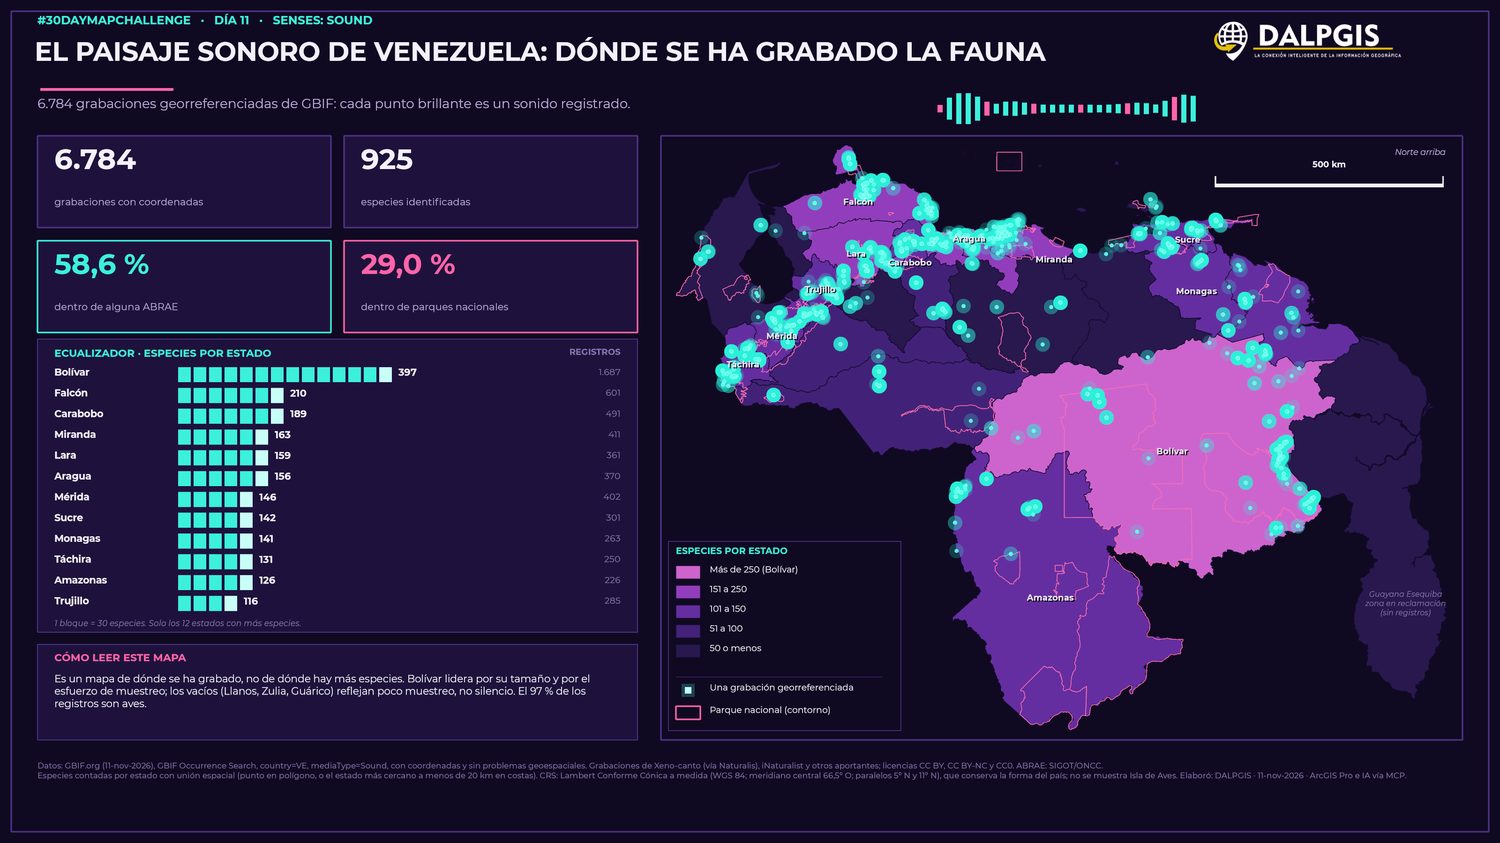
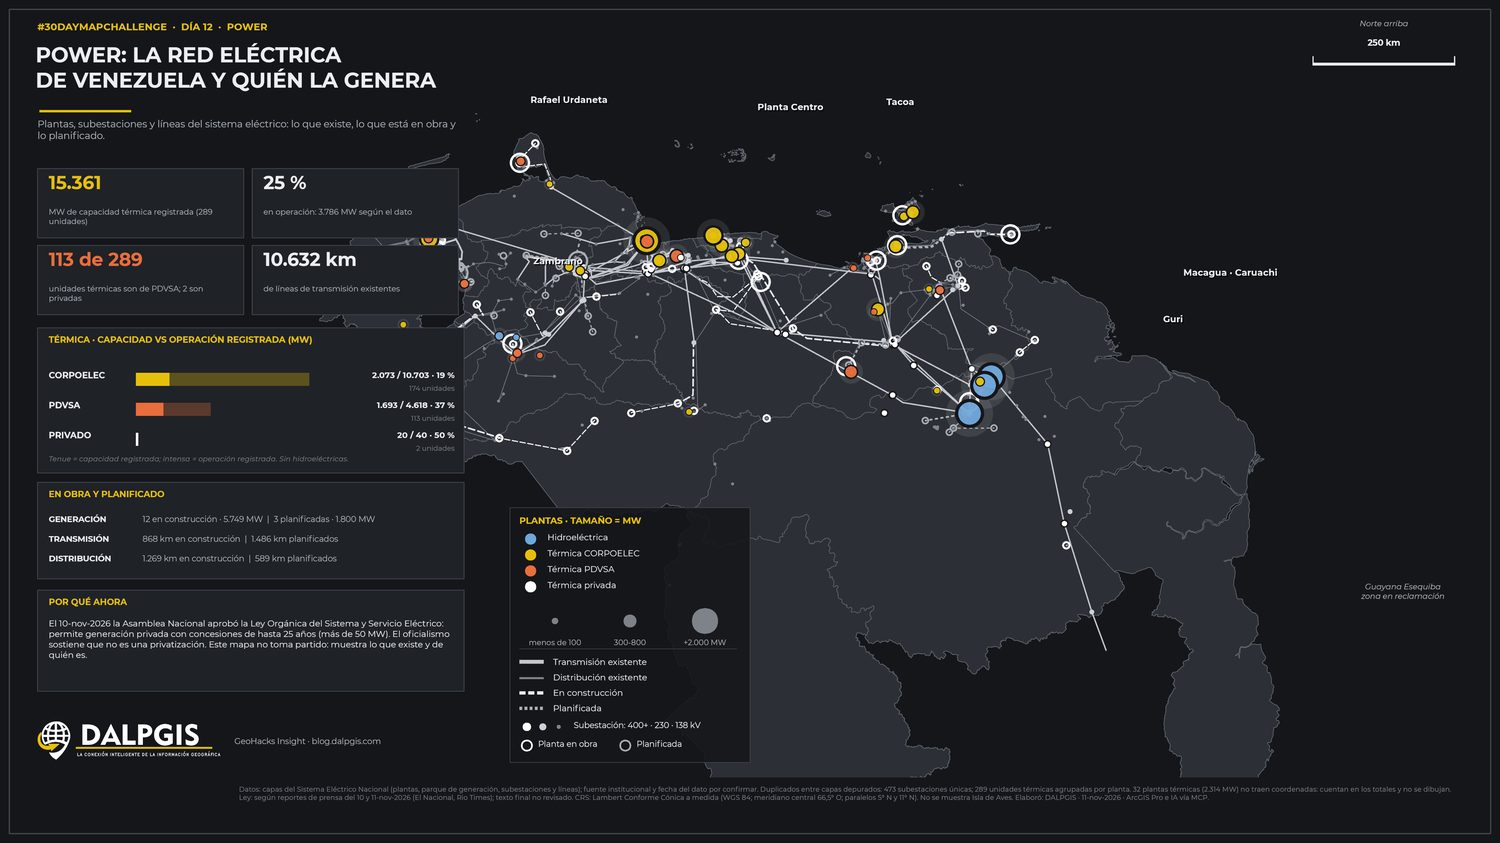
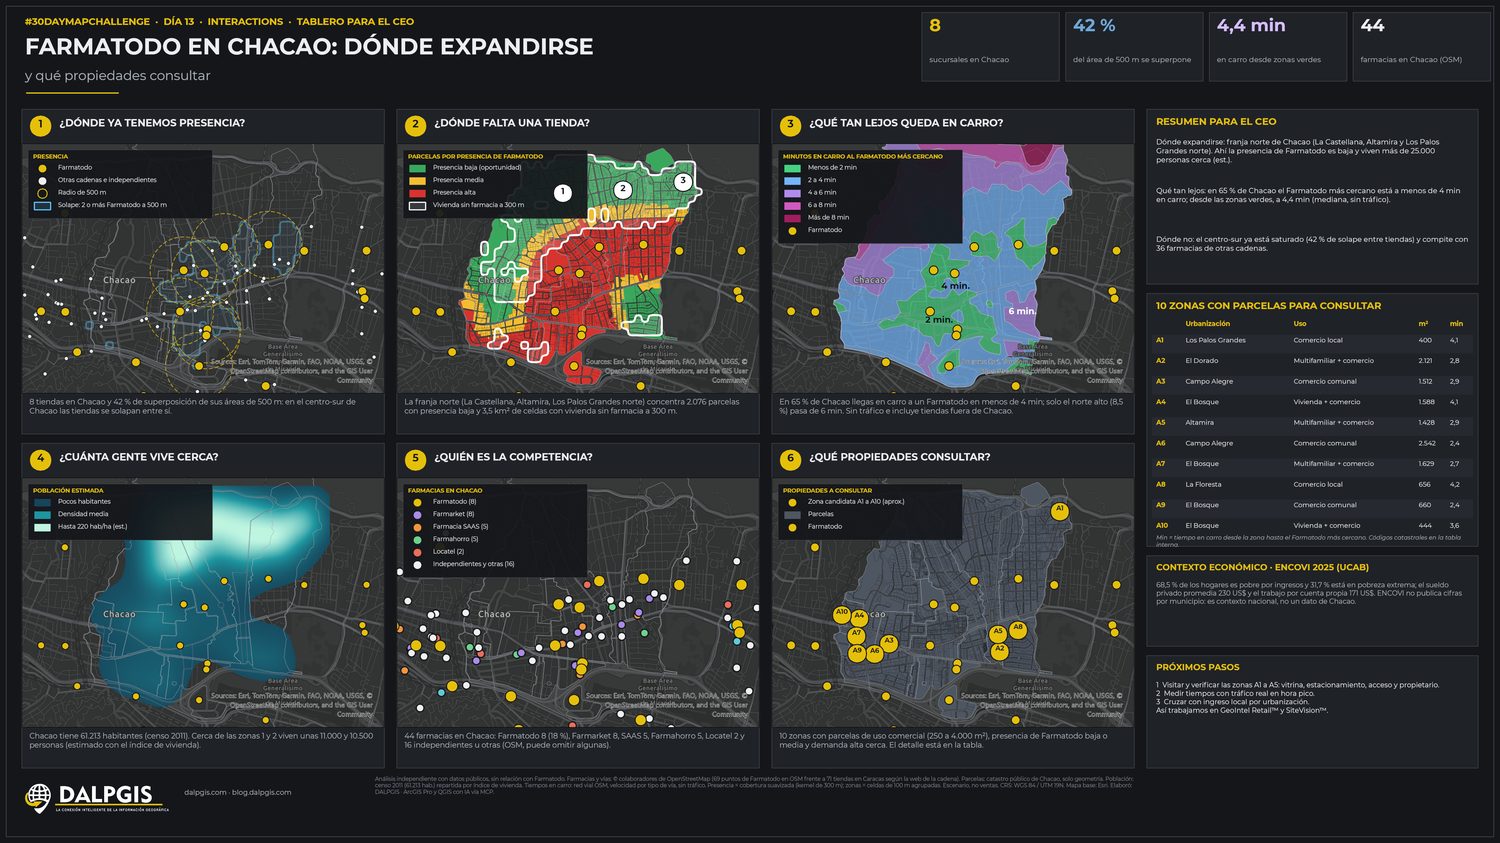
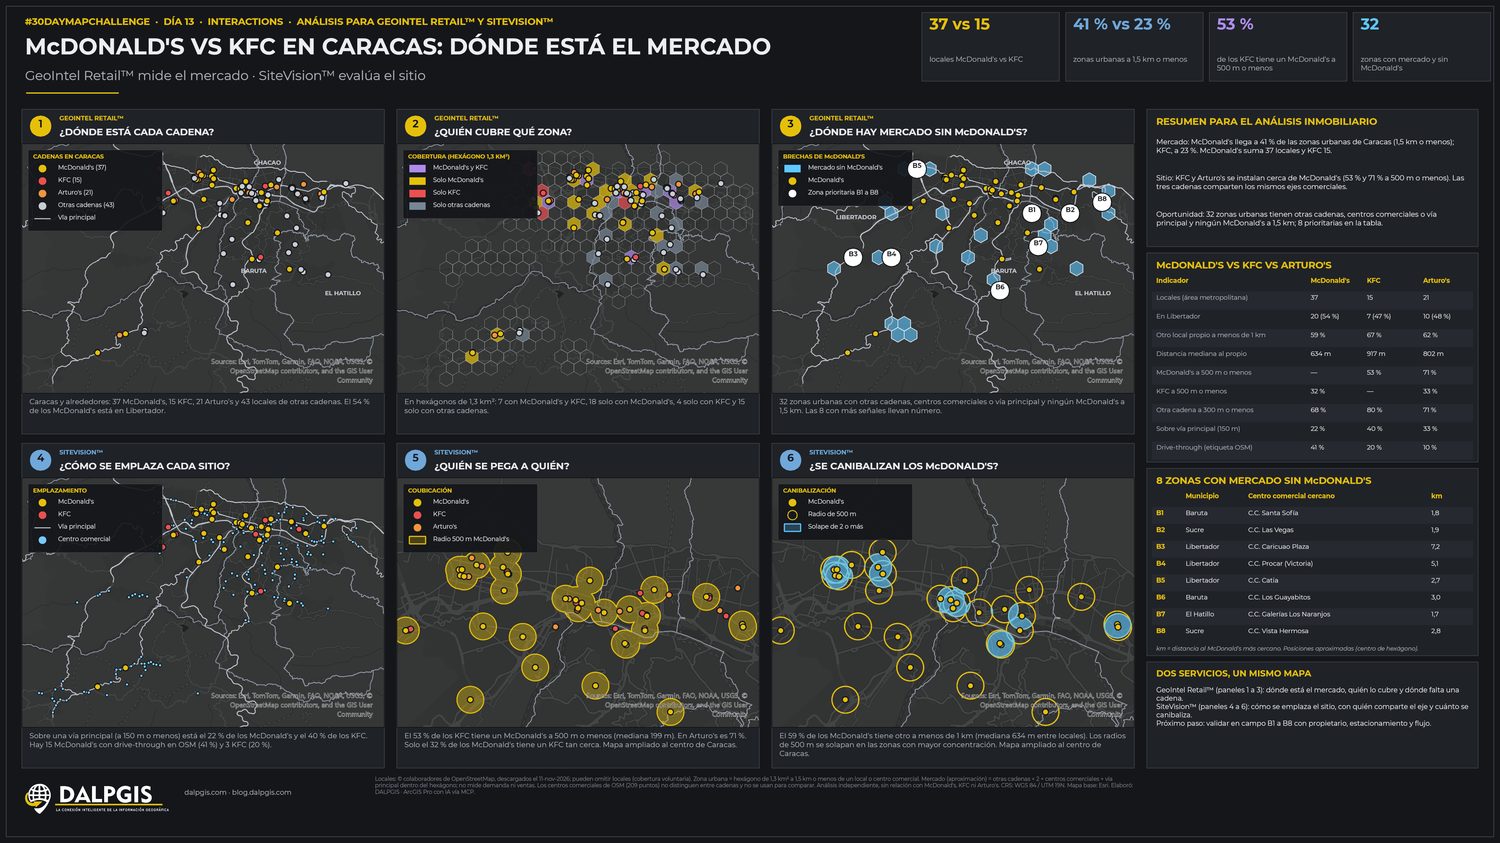
Day 2 · Lines — The Tocuyo river, order by order49% of the network's length is first-order streams. A 30 m DEM, Strahler orders and an 18,257 km² basin in one frame. · QGIS + PythonDay 3 · Polygons — 255 oil blocks, 9 deals in 2026Who signed what, where: contracts and adjustments shown over the whole block fabric. · QGISDay 5 · Vintage — An oil-concession chart, old-atlas styleSame data as Day 3, dressed as a 1930s atlas plate to show cartographic style is a choice. · QGISDay 5 · Senses: sight — What you can see from the summitFrom Tirgua's highest point an observer sees 2,674 km² of terrain, up to 69 km away. · QGIS + GDAL viewshedDay 7 · 10-minute map — Venezuela at nightVIIRS night lights tell the story: one glowing oil corridor in the north, an almost dark south. · Google Earth EngineDay 8 · Utopia — An energy utopia for Venezuela34–36 GW installed, over 63% out of service, roughly 12 GW delivered against 15.5 GW of demand. · QGISDay 9 · Urban/rural — Where Caracas grewThe built-up area doubled (×2.05) since 1975 and now covers 14,834 ha, squeezed into one valley. · QGIS + remote sensingDay 10 · Prompting only — Same data, three ways to askOne protected-areas dataset (192 polygons), three prompts. The vague prompt scored 0/6, the expert one 6/6. · AI + QGISDay 11 · Soundscape of Venezuela6,784 georeferenced recordings, 925 species. 58.6% fall inside a protected area (ABRAE). · GBIF + QGISDay 12 · Power — The grid and who generates it15,361 MW of thermal capacity, 25% reported operating, 10,632 km of transmission lines. · QGISDay 13 · Interactions — Where should a pharmacy chain expand?A one-page decision board for a CEO: presence, gaps, competition, demand. · Geomarketing + QGISDay 13 · Interactions — Fast-food market, store by storeTwo chains compared by coverage, catchment and competition in Caracas. · Geomarketing + QGIS