Remote Sensing & GEE
Fire monitoring app for the central Llanos with Google Earth Engine
A web app that counts fire hotspots and tracks carbon monoxide for any state, year and month, with charts generated on demand.
The challenge
Seasonal fires in the central plains are widely discussed but rarely measured in a way a decision-maker can query. The need was an easy tool to ask: how many fires, and how much carbon monoxide, in this state, in this month?
The solution
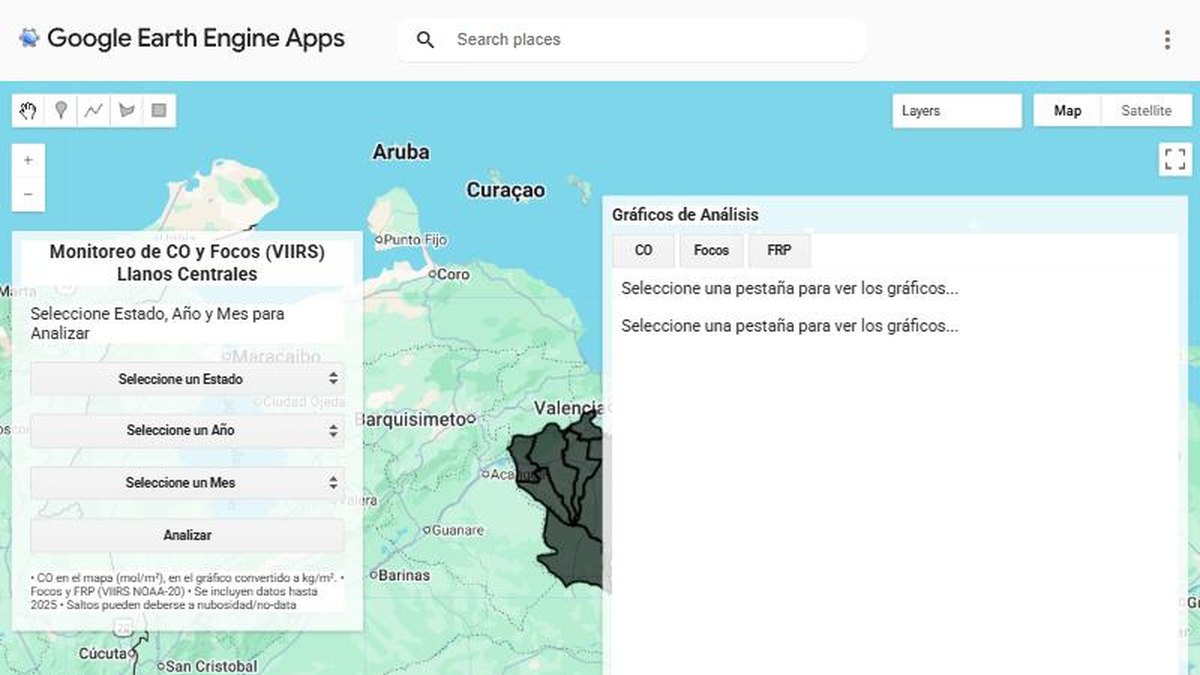
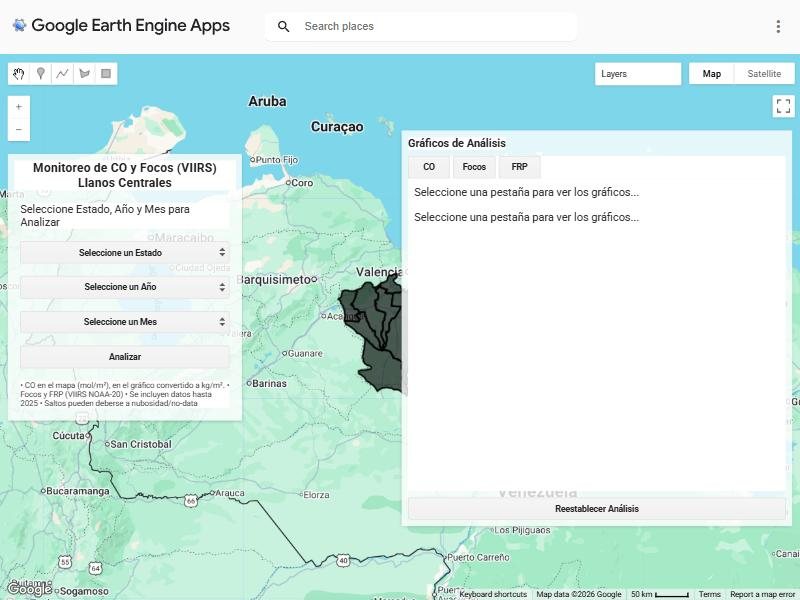
I built a Google Earth Engine App where the user picks a state, a year and a month. The server processes satellite data and returns a map of hotspots plus time-series charts for CO and fire radiative power.
- Data: VIIRS active-fire detections and carbon monoxide from satellite products.
- Logic: filter by administrative boundary and period inside Earth Engine, so nothing is downloaded.
- Interface: selectors, an Analyze button and charts, with no coding needed.
Results
- Any state, year and month analysed in seconds from a web link
- Hotspots, CO and fire power in the same panel
- Runs in the browser: nothing to install
Deliverables
Earth Engine App · Documented script
Gallery
Next step
Need something similar?
Tell me about your data and your goal. I will reply with a clear approach, timeline and quote.