Geomarketing
How many visits is too many? Saturation analysis for a touring business
An Excel model with an adjustable radius that counts earlier nearby events and the rest time between them, to show where a market is saturated.
The challenge
A business that visits the same areas again and again needs to know when it is overusing a market. Two questions matter: how many times have we already been near this place, and how long has it been since the last time?
The solution
For every event I calculate, as of its date, the number of earlier events within a chosen radius and the date of the most recent one. Both fields live in an Excel workbook where the radius is a single input cell: change 25 miles to 10 or 50 and every column, and the summary, recalculates without rebuilding anything.
- Distance: great-circle (haversine) distance between every pair of events.
- Saturation fields: prior visit count, most recent prior visit, visit number and days since last visit.
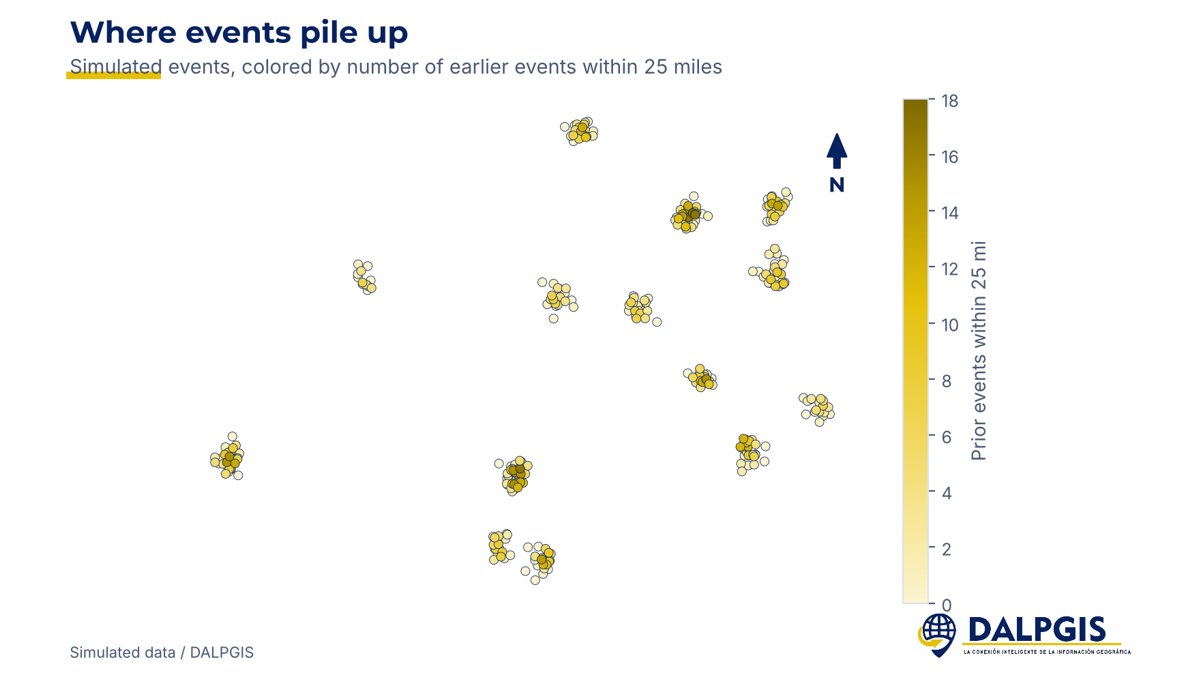
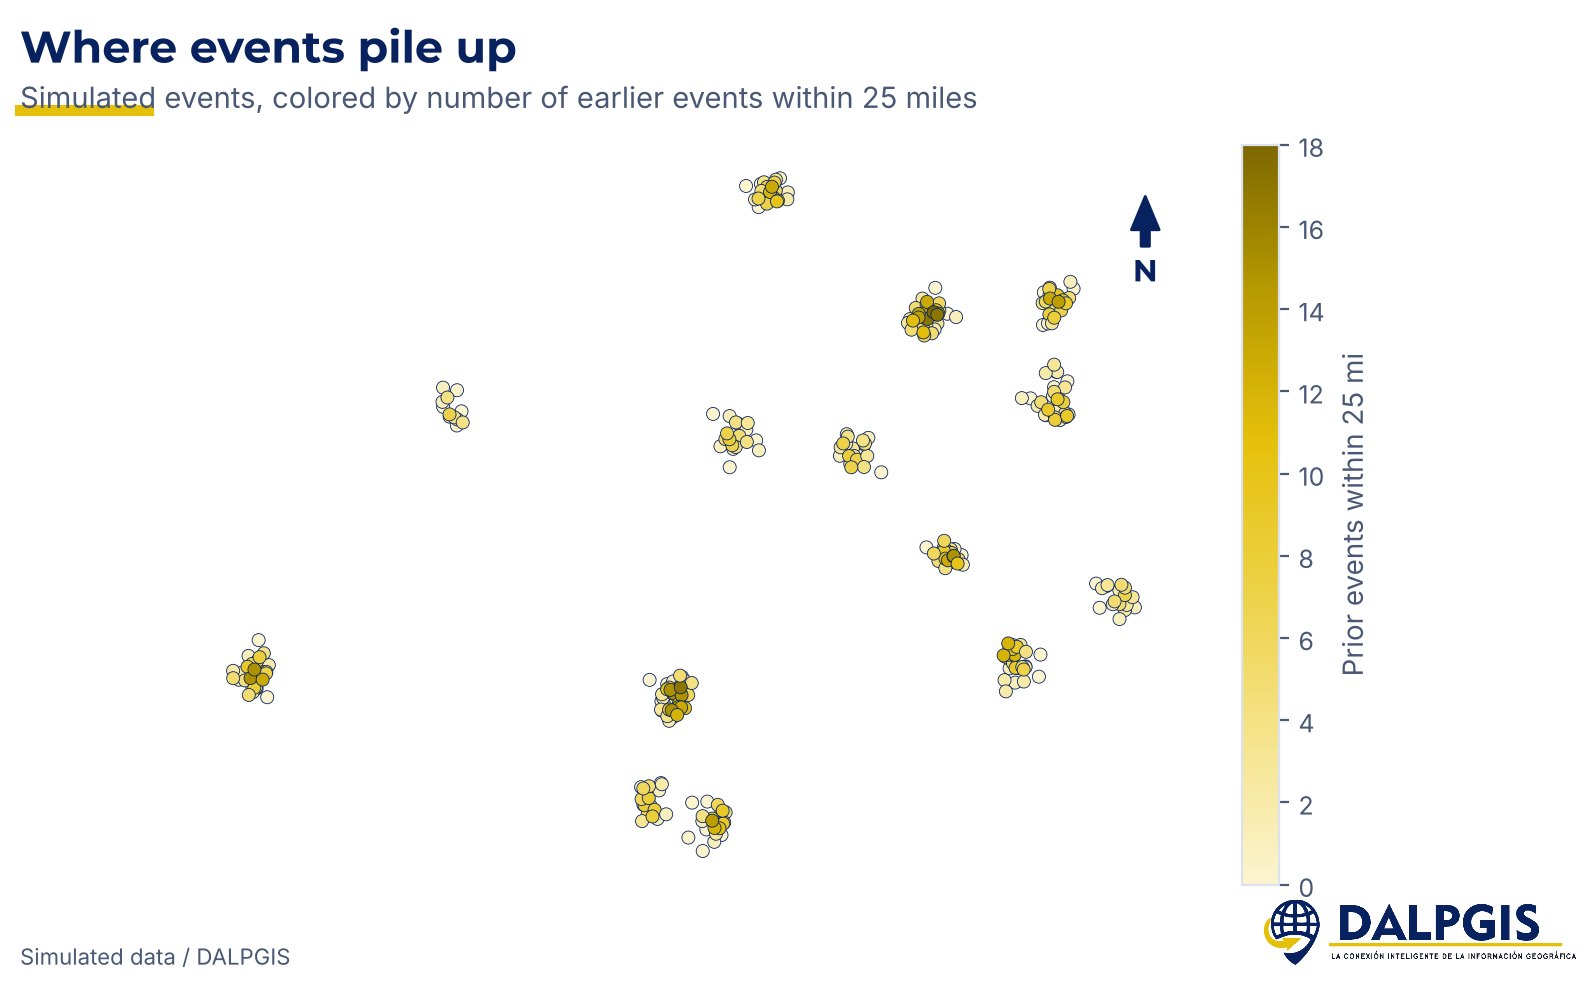
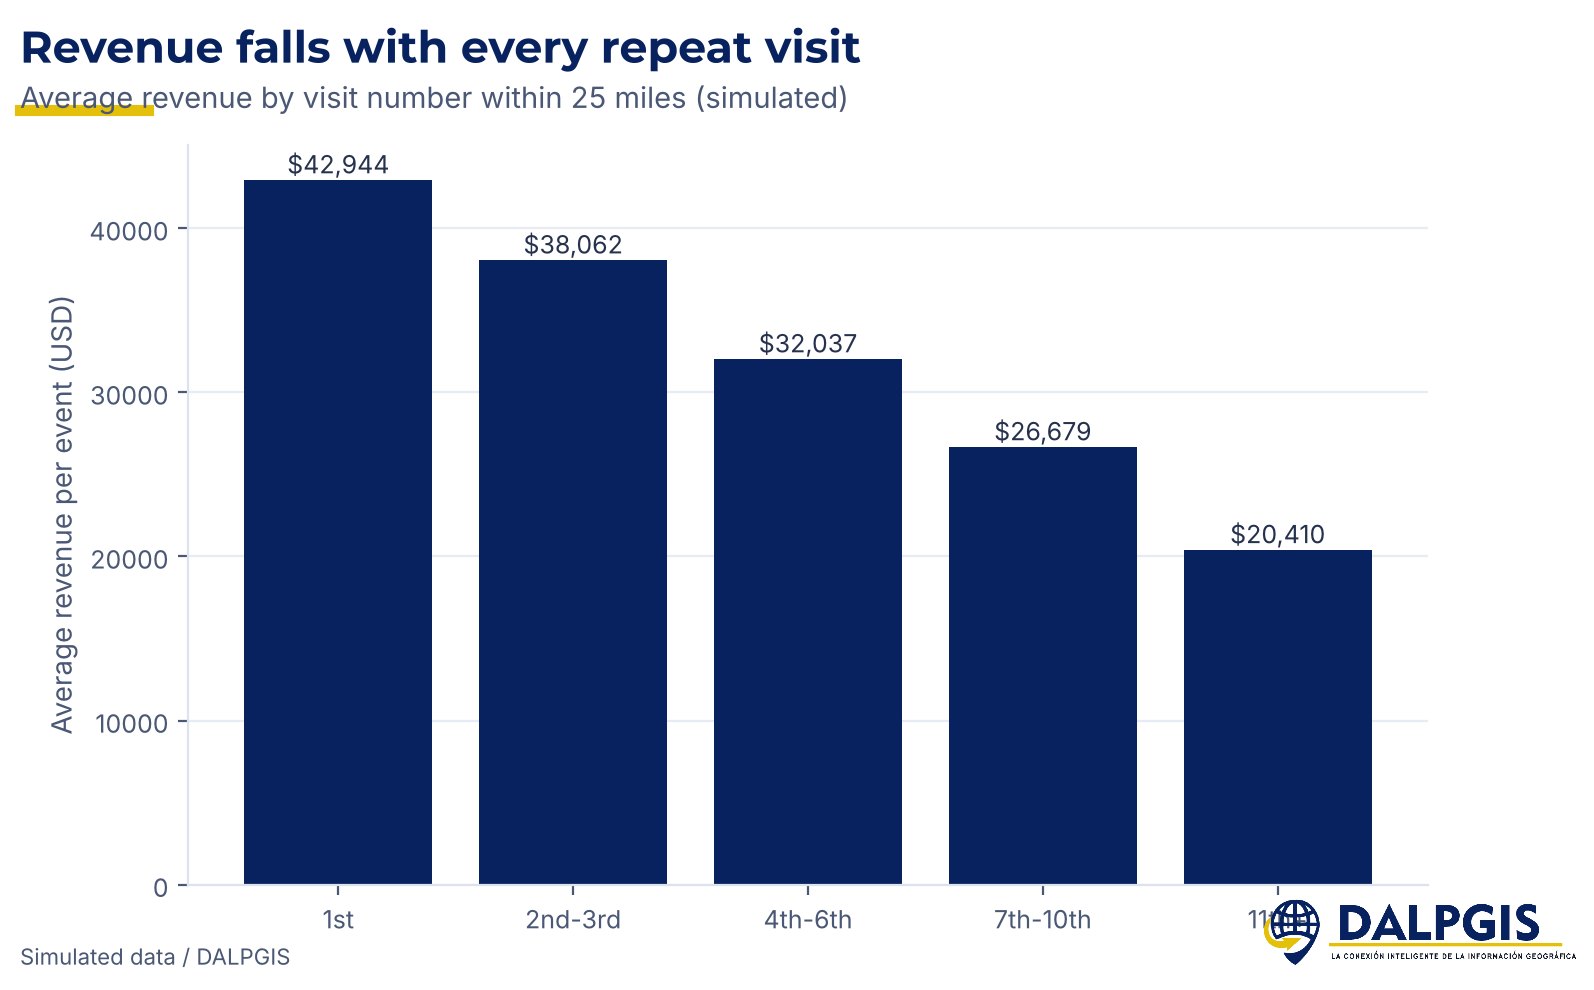
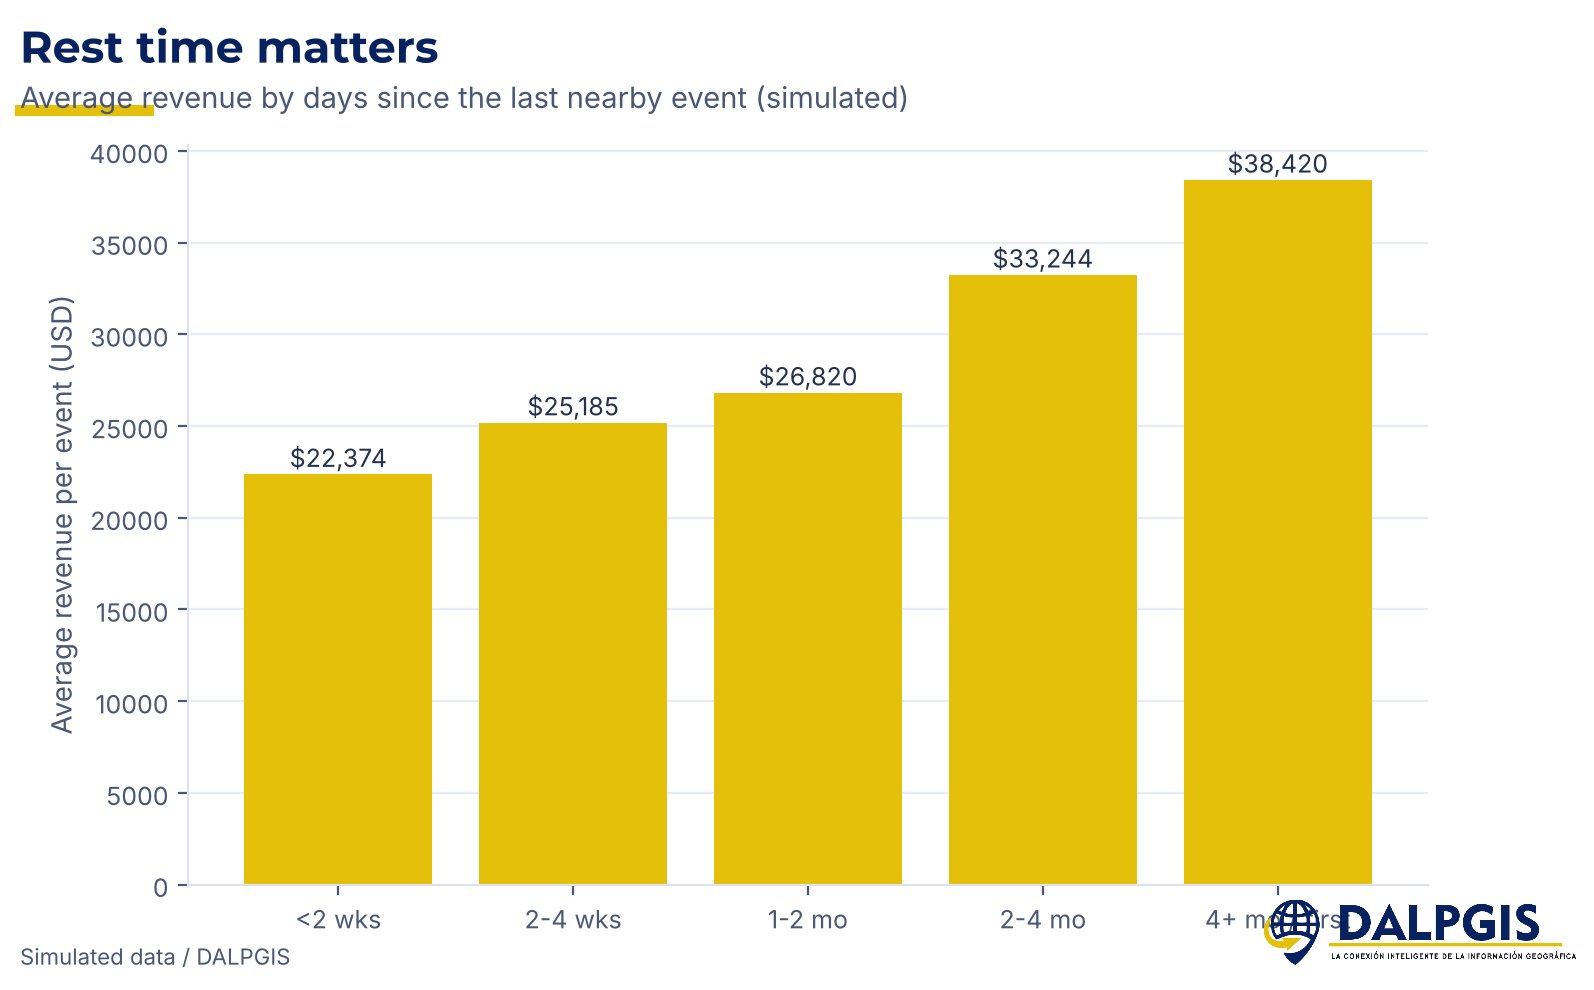
- Analyse: average revenue by visit number and by rest time, plus a map of where events pile up.
Results
- A 360-event simulated history, analysed at any radius with one cell
- In this demo, revenue per event drops from about $43,000 on a first visit to about $20,000 from the 11th visit on
- Rest time matters too: events less than two weeks after a nearby one average about $22,000, against about $38,000 after four months or more
About the data. This case is a demonstration built with simulated events and revenue. The patterns above come from the simulation and are not real results. The method is the same one I apply to real client data.
Deliverables
Download the simulated Excel model · Saturation map · Summary charts
Gallery
Next step
Need something similar?
Tell me about your data and your goal. I will reply with a clear approach, timeline and quote.